Cryptozoology, 13, 1997-1998. 47-75
© 1998 International Society of Cryptozoology
SASQUATCH: SIZE, SCALING, AND STATISTICS
Wolf H. Fahrenbach
Beaverton, Oregon, U.S.A.
Hennerf@bfro.net
Abstract: Measurements and estimates on Sasquatch dimensions, collected over the last 40 years in the Western U.S and Canada, were subjected to statistical analysis and extrapolation by scaling laws appropriate to primates and mammals. The study has yielded average population values for foot length and width, scaling factors of foot length to height, values for weight, plantar pressure, walking and running gait, speed, and a tentative growth curve as a function of time for the female of the species. The results suggest a substantial population with traits different from those of other higher primates and humans.
Introduction
Over the last half century, several thousand eyewitness reports of Sasquatch (Bigfoot) sightings, footprints, and other circumstantial evidence have accumulated (Bord and Bord 1982, Deery, Glickman, and Wolman 1997, Green 1978, 1980a, 1980b, 1980c, Perez 1988). Although Green (1978, 1980c) has collated his collected observations in synoptic fashion, the numerical values contained in the sources have not been explored statistically. A sufficiently large sample size, as we have for many measurements, has the advantage of supporting through such treatment either an origin from a living population of animals or, conversely, exposing a set of fictitiously generated values.
Any editing method for these data invariably involves a value judgment by the investigator, who gauges the credibility of eyewitnesses by assorted criteria that are apt to vary from person to person, are often arbitrary, and will always be fallible. Therefore, I am using here all the available measurements at the risk of increased statistical noise. Excluded are only reports with preternatural content. Many data sets suffer from inherently large systematic error sources that will be mentioned and must be contended with. A systematic confounding variable in the entire set is the lumping of all ages and the two sexes, the latter having been reported to be dimorphic in body size and other attributes. Values derived from the Patterson movie film of 1967 do not carry any special weight other than the chest circumference, for which it is the only source.
I am operating under the premise that the Sasquatch is a living primate rather than an elaborate, figment of the imagination. Therefore, I have availed myself of various pertinent allometric scaling formulae for mammals in general and primates in particular. These permit a more rational extrapolation to different physical aspects of the species than pure guesswork allows. The principle of allometric scaling consists of fitting a straight line to a logarithmically transformed, bivariate data set, generally derived from many different related species, according to the formula
![]()
where Y = some specific aspect of the animal under investigation, be it a morphological, ecological, or physiological variable;
a = the allometric coefficient, a constant which defines the intercept on the Y axis, i.e., the position of the line;
X = some measure of body size, generally weight; and
B = the allometric exponent or scaling factor, which defines the slope of the line.
With the data on hand and a combination of statistics and judicious extrapolation, I am providing a numerical framework for discussing the Sasquatch. Such guidelines can and should subsequently be modified by additional data, but will resist extravagant claims or wild speculation unless they are buttressed by substantial new data and not just isolated anecdotal reports. The statistical approach will serve to blunt the impact of included spurious, duplicate, or erroneous data. Readers who wish to delve deeper into the subject of allometry, including the risks and pitfalls of inter- and intraspecific scaling, will find details in such sources as Calder (1984), Jungers (1985a), Martin (1984), Martin and Harvey (1985), McMahon and Banner (1973), and West, Brown, and Enquist (1997).
I wish to emphasize that this publication constitutes personal research, and has in no way been aided or financially supported by the academic institutions with which I am, or have been, affiliated.
Methods
Most of the data were collected by John Green (1968, 1978, 1980a, 1980b, 1 980c), of Harrison Hot Springs, British Columbia, Canada, over the past 40 years. All the data originate from the Western states of the U.S.A. (Alaska, Washington, Oregon, California, Idaho, Nevada, Montana, Utah, Wyoming, Colorado, New Mexico), and the Western provinces of Canada (British Columbia and Alberta). They have been further supplemented by some published values (Napier 1972, Hewkin 1987), by the records of the North American Science Institute as collected by the Bigfoot Research Project under the direction of Peter Byrne, by a small personal collection, and by a few details visible and measurable in the Patterson movie film (Bayanov, Burtsev, and Dahinden 1984, Jeff Glickman, personal communication, Glickman 1997, Hunter and Dahinden 1993, Krantz 1992, Perez 1992, Sprague and Krantz 1979). Statistical calculations and graphing were performed with Statworks and Kaleidagraph on a Macintosh computer.
Enlarged prints of Patterson film frames referred to in a subsequent section are commercially available from Progressive Research, Department 291, 720 Sixth Street, New Westminster, British Columbia, Canada V3L 3C5.
Results and Discussion
Foot Length
 Footprints are the
standard stock in trade of Sasquatch research, and their sometimes inhuman
length assures almost immediate measurement, even by first-time witnesses. Such
measurements or estimates benefit from the fact that they are made in the cold
light of day, often with a ruler, and generally removed in time from the
adrenalin-induced jitters experienced after most of the direct visual
encounters. On soft ground, slide-in of the foot might elongate the heel
somewhat, although it thereby also points it. Snow prints always incur the
criticism of possible enlargement due to melting, except when in a thin layer
of fresh snow. This criticism is apparently not based on experimentation with
snow footprints, and may be groundless. Conversely, expertly collected walking
and running prints, laid down by the same animal in a thin layer of soft mud
overlying clay hardpan, showed no slippage whatsoever (Heryford et al. 1982).
In all cases, the flat Sasquatch footprint corresponds to a human foot outline
rather than a human walking print, in which the arch may not touch a hard
surface. Comparison of prints in a Sasquatch trackway show a common tendency of
the toes to be curled, thereby shortening the measured foot somewhat.
Repetitive measurement of some individuals are undoubtedly and inevitably
included, since their common identity cannot be ruled out under most
circumstances.
Footprints are the
standard stock in trade of Sasquatch research, and their sometimes inhuman
length assures almost immediate measurement, even by first-time witnesses. Such
measurements or estimates benefit from the fact that they are made in the cold
light of day, often with a ruler, and generally removed in time from the
adrenalin-induced jitters experienced after most of the direct visual
encounters. On soft ground, slide-in of the foot might elongate the heel
somewhat, although it thereby also points it. Snow prints always incur the
criticism of possible enlargement due to melting, except when in a thin layer
of fresh snow. This criticism is apparently not based on experimentation with
snow footprints, and may be groundless. Conversely, expertly collected walking
and running prints, laid down by the same animal in a thin layer of soft mud
overlying clay hardpan, showed no slippage whatsoever (Heryford et al. 1982).
In all cases, the flat Sasquatch footprint corresponds to a human foot outline
rather than a human walking print, in which the arch may not touch a hard
surface. Comparison of prints in a Sasquatch trackway show a common tendency of
the toes to be curled, thereby shortening the measured foot somewhat.
Repetitive measurement of some individuals are undoubtedly and inevitably
included, since their common identity cannot be ruled out under most
circumstances.
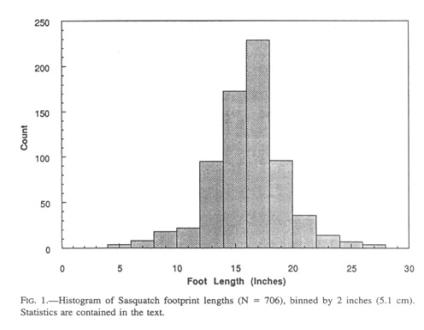
Descriptive statistics of the collected footprint lengths (Fig. 1) are as follows:
N = 706
Range = 4”—27” (10.2—68.6 cm)
Mean = 15.6” (39.6 cm)
Median = 16” (40.6 cm)
Standard Deviation = 3.1” (7.9 cm)
Standard Error = 0.12” (3 mm)
Skewness = - 0.16
Kurtosis = 1.89
Both mean and median have changed little with addition of data over the past years. The standard deviation implies that 99.73 percent (± 3 S.D.) of the footprints of the population are going to fall between 6.3” and 24.9” (16 and 63.2 cm). The distribution has a tail at either end and a sharp median, giving the curve a kurtosis (the peakedness or flatness of a statistical distribution) slightly above unity, i.e., more peaked than a normal distribution. This aspect is not supportive of a significant sexual dimorphism, as has been proposed for the Russian “wildman” (Sapunov 1988), in which a bimodal distribution depresses the kurtosis below unity. At most, it can be speculated that, at the median of footprint size, the sexual dimorphism does not exceed 2” (5 cm) in foot length, or roughly 1 foot (30 cm) in body height. Reproductively mature females (as judged by the presence of an infant; see below under Growth) range in foot length from 13” to 19” (33 to 48 cm), as collected to date. Hence, the largest prints are most probably from males, also supported by eyewitness reports of such animals being more facially hirsute and devoid of breasts.
The slight skewness of the curve (asymmetry of a statistical distribution) to the left of the mean might be attributable to the contribution of juveniles smaller than the population mean, and their attrition before adulthood. The normal distribution overall argues compellingly against any alternative hypothesis to the existence of the Sasquatch as a cryptic species, in that production of fictitious data over 40 years by hundreds of people independently of each other would have generated a distribution with many peaks (Sapunox 1988). A further factor that supports the authenticity of the data is the fact that foot length, foot width, heel width, and gait are interrelated in a logical and cohesive fashion, a congruence not plausible by pure chance.
As a telling comparison, Napier’s collection (Napier 1972) can be taken by itself. Its 59 footprints have a mean length of 15.5” (39.4 cm), a median of 16” (40.6 cm), and a standard deviation of 2.99” (7.59 cm). Thus, the mean of his collection deviates by merely 2 millimeters from the larger population mean.
For comparison, the American adult male foot has a mean length of 10.4’ (26.5 cm; N = 672), and the female 9.5” (24 cm; N = 225) (Robinson 1990). The maximum human foot length recorded, 18.5” (47 cm), belonged to a pituitary giant (McMahon and Bonner 1983), and clearly represents a pathological state.
Many of the data points represent a single measurement out of a trackway that might have extended over many yards or, in some cases, over several miles, where the ground and expertise of the investigator allowed uninterrupted tracking. Undoubtedly, only a fraction of the population of any species is ever represented by recorded tracks. Giving the Sasquatch a life expectancy of about 40 years (see below), and a montane, wet environment not conducive to the preservation of tracks, these 706 prints collected over a 40-year period indicates a substantial population, probably in the “low thousands,” as speculated by Krantz (1992).
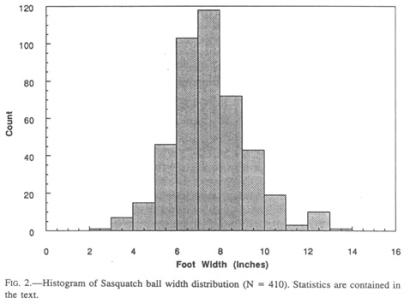
Ball Width and Width Index
One of the characteristics of Sasquatch footprints that sets them apart from their human counterparts, aside from length, is the disproportionate width at the ball of the foot (Fig. 2), a ratio that is reminiscent of the foot of a human infant. The width is subject to more alteration during walking than is the length due to lateral expansion in different substrata, but no allowance for this error source can be made.
Descriptive statistics of the collected footprint widths are as follows:
N = 438
Range = 3”—13.5” (7.6—34.3 cm)
Mean = 7.2” (18.3 cm)
Median = 7” (17.8 cm)
Standard Deviation = 1.69” (4.29 cm)
Standard Error = 0.08” (0.2 cm)
|
|
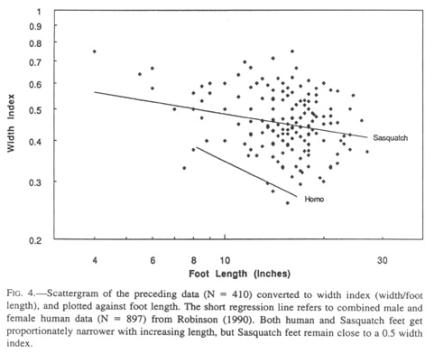
It is obvious from the scatter of the data that enormous individual variations exist, partly by dint of embedded presumptive sexual dimorphism. Although sufficient data are not available, the feet of females may be narrower than those of males. The Patterson film female has a width index of 0.41, comparable to that of human infants (0.43; Roche and Malina 1983). Similar individual and sex-linked variations can also be found among humans.
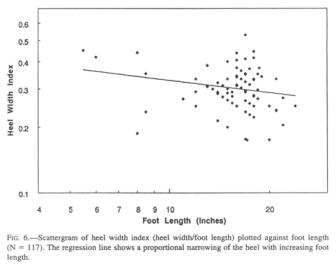
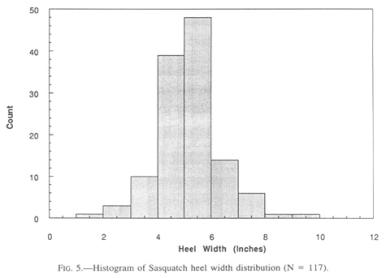
Heel Width and Heel Width Index
Heel width statistics were anticipated with particular interest, since Krantz (1992) speculated that the width of the heel would have a direct and possibly predictive relationship to weight. He adduces the observation that the width of the talus represents a stable proportion of the human heel width, and is a function of the bearing strength of the pertinent joint cartilage. At first sight, the heel width histogram (Fig. 5) mirrors that of the foot lengths rather closely, though being lower in numbers. The widest Sasquatch heels challenge one’s credulity unless one has seen the proportion of the heel to the size of the whole foot.
Descriptive statistics of the collected heel widths are as follows:
N = 123
Range = l.5”—9” (3.8—22.9 cm)
Mean = 4.83” (12.3 cm)
Median = 5” (12.7 cm)
Standard Deviation = 1.17” (2.97 cm)
Standard Error = 0.105” (0.27 cm)
 As is the case with the
ball of the foot, the heel does not grow isometrically with the length of the
foot, but lags behind (Fig. 6), as does the human heel. The Sasquatch appears
to rely less on the heel plant in walking, but rather bears more of its weight
on the broad anterior part of the foot, distal to the metatarsal hinge (Jeffrey
Meldrum, personal communication) or, for that matter, more evenly distributed
over the entire sole in the absence of an arch. Placement of the Sasquatch foot
on a suitable substratum has been observed to produce a slapping sound,
implying a foot placement that is not congruent with a heel plant and a
subsequent forward rolling of the foot, as occurs in the human foot with its
rigid arch. In an expertly documented track of footprints (Heryford et al.
1982), the footprint changed from a normal shape during calm walking to a
roundish footprint (i.e., the anterior half of the foot) during running (step
length changing from 4’ to 9’; 122 to 274 cm), in which the heel never touched
the ground. The scatter of the heel width data argues against using these
values in weight estimates.
As is the case with the
ball of the foot, the heel does not grow isometrically with the length of the
foot, but lags behind (Fig. 6), as does the human heel. The Sasquatch appears
to rely less on the heel plant in walking, but rather bears more of its weight
on the broad anterior part of the foot, distal to the metatarsal hinge (Jeffrey
Meldrum, personal communication) or, for that matter, more evenly distributed
over the entire sole in the absence of an arch. Placement of the Sasquatch foot
on a suitable substratum has been observed to produce a slapping sound,
implying a foot placement that is not congruent with a heel plant and a
subsequent forward rolling of the foot, as occurs in the human foot with its
rigid arch. In an expertly documented track of footprints (Heryford et al.
1982), the footprint changed from a normal shape during calm walking to a
roundish footprint (i.e., the anterior half of the foot) during running (step
length changing from 4’ to 9’; 122 to 274 cm), in which the heel never touched
the ground. The scatter of the heel width data argues against using these
values in weight estimates.
|
|
|
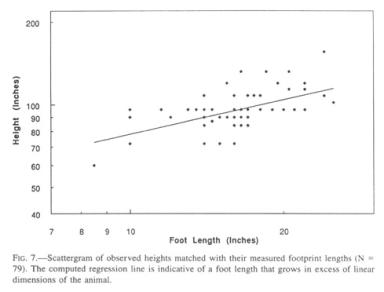
Height and Height Factor
No complete body prints hive been measured in conjunction with footprints of their respective owner, despite the fact that a few such rare artifacts have been observed (as is the case for hand, knuckle, knee, and gluteal prints). A starting point is the Patterson movie film. Patterson himself estimated that Sasquatch to be 7’4” (2.23 m) tall, while all other ex post facto estimators argued for lower values. Detailed image analysis of side views of that animal, combined with superimposed pictures at the same site with an included height reference in the form of a graduated pole (Jeff Glicktnan, personal communication), have yielded a body height of 7’3.5” (222.3 cm), with a foot length of 14.5” (36.8 cm) measured directly from the associated footprints. This combination yields a foot-to-height multiplier (“height factor”) of 6.04, a value that can also be expressed as the foot-length-to-height ratio of 16.5%, as is done in the case of human foot-to-height estimates (Robbins 1986). The rear views of the same filmed Sasquatch, with its bent knees and slumped posture, does not readily extrapolate to this height. There is reason to believe that, in a setting without reference points, observers underestimate the height of a Sasquatch by intuitively assigning anthropomorphic dimensions.
More importantly than this one example, which remains under debate and could, furthermore, be ignored for the purpose of this analysis, the database contains a cohort of 89 reports for which both the height was visually estimated by the witnesses and the corresponding footprint was subsequently measured after the sighting.
|
Descriptive statistics for foot length: |
Descriptive statistics for height: |
|
N = 89 |
N = 89 |
|
Range = 8.5”—25” (21.6—63.5 cm) |
Range = 5’—13’ (152—396 cm) |
|
Mean = 16.6” (42.2 cm) |
Mean = 8.1’ (247 cm) |
|
Median = 16.5” (41.9 cm) |
Median = 8’ (244 cm) |
|
Standard Deviation = 3.2” (8.1 cm) |
Standard Deviation = 15” (38.19 cm) |
The mean height factor for this group, with its slightly higher mean for foot length than the general population, is 5.84, i.e., lower than that applicable to the Patterson film Sasquatch. The change in the height factor with increasing size is borne out by the regression line for this set of data (Fig. 7), which yields the empirical allometric formula
![]()
[H = height in inches, L = foot length in inches] (correlation coefficient = 0.558). The formula will benefit from subsequent revision by way of tightly established, paired measurements, but it demonstrates in principle one important feature, namely, that Sasquatch feet grow allometrically, i.e., in substantial excess of general somatic dimensions. Thus, the term “Bigfoot” is not an empty phrase. Application of this formula yields a height of 9’5” (286 cm) for a 24” (61 cm) foot, 7’7” (232 cm) for a 14.5” (37 cm) foot, and 7’ (214 cm) for a 12” (30.5 cm) footprint. It should be remembered that these values average male and female heights, hence the value for the 14.5” foot is higher than that applicable to the Patterson film female. Visual inspection of the scattergram suggests that the formula in its present state might overestimate height for small footprints and vice versa at the high end. It has, however, the compelling advantage of not being dependent on the opinion of a single investigator.
Only time and additional data will tell how the slope of the curve (the scaling exponent) or its relative position (the constant) will have to be revised. As it stands, the foot length-to-height multiplier (height factor) is near 5 for the largest prints, about 6 for the mean and 7 or higher for the low end. Human ratios that I have sampled range from 5.1 to 7.2, and probably exceed these values below and above. Extrapolation to values at birth is exceedingly risky, but a Sasquatch with a foot size of 3.5” (8.9 cm) and a body length of 20” (50 cm) or more is in keeping with human and gorilla dimensions. These are 8.2 cm (3.2”) and 9.3 cm (3.7”) for foot length, and 50 cm (20”) and 45 cm (17.7”) for total body length for human and gorilla, respectively.
Foot growth in excess of the linear dimensions of the rest of the body makes sound biological sense, since body weight increases by the cube (actually as a power of 2.9; McMahon and Bonner 1983) of the height of the individual, but the support surface, the sole, increases only by the square. Therefore, the foot would experience increasing loading pressures unless this tendency was compensated for by differential growth. Implications for plan-tar pressure in the Sasquatch will be explored below.
Gait
A large number of sequential Sasquatch tracks have been measured and recorded, but almost all of the records suffer from the same uncertainty, namely, whether the step length was measured between footprints (i.e., from toe to next heel) or from a point on one foot to the identical point on the opposite foot, which is the correct method. The result is an inevitable average underrecording of step length by some amount of the referenced footprint length. This means that the values for step length presented are likely to be extremely conservative. In addition, normal step lengths grade continuously into slow amble and shuffling or, at the other extreme, into an accelerated pace and running. Additionally, trackways of short steps are easily recorded, whereas running footprints, with their long distances between footfalls, are much less likely to be recovered in the usual forested terrain.
The term stride is reserved for three sequential steps in a trackway, an indexing mode useful for measuring the step angle and the width of the trackway (Mossman and Sarjeant 1983). Gait is the generic term for quadrupedal or bipedal locomotion, and pace is taken to be synonymous with step.
Most footprints have obviously been imprinted in the absence of human observers (except for 89 sets cited above); hence, they presumably represent the most economical, average striding gait of the animal. Obvious shuffling footsteps in Green’s collection of data have not been included as gait. Lastly, favored step length is a composite that conveniently combines such factors as weight, leg length or hip height, and natural pendulum periodicity of arms and legs in one measurable unit.
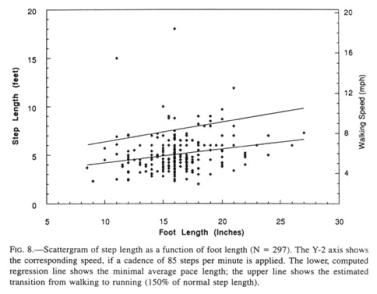 The step file consists
of 297 records, whose footprint statistics closely match that of the general
list of foot lengths above. The step length for the mean foot length is 5’ (152
cm). The computed regression line (Fig. 8, lower line) provides us with a low
estimate of Sasquatch step length, given the underreporting of running steps
and the ease of finding short steps in succession. The Patterson film
Sasquatch walking cadence amounted to 85 steps per minute as extracted out of
the data of the film (recorded at 16 frames per second; Bayanov, Burtsev, and
Dahinden 1984, Krantz 1992) (960 frames per minute film speed: 11.25
frames/step = 85.3 steps/min). For a human step, that cadence is either
uncomfortably slow if the step is long, or, if short, appropriate to an old or
debilitated walker. If this cadence is multiplied by the step length of 70”
(Robert Gimlin, taped interview with John Green, 1996), a speed of 5.7 mph (9
km/h) is obtained. If it is applied to other sizes of Sasquatch feet, a
conservative walking speed emerges, which coincidentally closely corresponds in
miles per hour to the step length in feet (Fig. 8, Y2 axis). Admittedly, the
walking cadence is inversely related to increasing leg length and weight
(Heglund et al. 1974), but the stride length increases with size. Incidentally,
the gait of the Patterson film Sasquatch lies only moderately above the
regression line, in congruence with its observed “unhurried” retreat from the
scene.
The step file consists
of 297 records, whose footprint statistics closely match that of the general
list of foot lengths above. The step length for the mean foot length is 5’ (152
cm). The computed regression line (Fig. 8, lower line) provides us with a low
estimate of Sasquatch step length, given the underreporting of running steps
and the ease of finding short steps in succession. The Patterson film
Sasquatch walking cadence amounted to 85 steps per minute as extracted out of
the data of the film (recorded at 16 frames per second; Bayanov, Burtsev, and
Dahinden 1984, Krantz 1992) (960 frames per minute film speed: 11.25
frames/step = 85.3 steps/min). For a human step, that cadence is either
uncomfortably slow if the step is long, or, if short, appropriate to an old or
debilitated walker. If this cadence is multiplied by the step length of 70”
(Robert Gimlin, taped interview with John Green, 1996), a speed of 5.7 mph (9
km/h) is obtained. If it is applied to other sizes of Sasquatch feet, a
conservative walking speed emerges, which coincidentally closely corresponds in
miles per hour to the step length in feet (Fig. 8, Y2 axis). Admittedly, the
walking cadence is inversely related to increasing leg length and weight
(Heglund et al. 1974), but the stride length increases with size. Incidentally,
the gait of the Patterson film Sasquatch lies only moderately above the
regression line, in congruence with its observed “unhurried” retreat from the
scene.
The slapping sound of Sasquatch footfalls (“as if it had flippers on”), reported occasionally for one walking on a suitably hard surface like a blacktop, suggests a different foot placement than in humans. There is also longer bipedal “double support” during the stride cycle (Krantz 1992), an adaptation that reduces peak forces during heel-strike and toe-off, and divides the body weight more evenly between the two feet. The frequently reported pattern of a standing Sasquatch swaying from side to side as if to shift the weight from one foot to the other may be related to plantar loading and its intermittent relief. Half footprints, which are not uncommon (Heryford et al. 1982, Hewkin 1987), in which only the anterior part of the foot is imprinted, are indicative of a simian metatarsal hinge (Jeffrey Meldrum, personal communication). This anatomical detail suggests a hominoid rather than hominid nature of the Sasquatch since the human arch appears to have substantial paleontological antiquity (Johanson, Johanson, and Edgar 1994).
The Sasquatch has evidently evolved a peculiarly long stride with a long arm swing, a slow cadence coupled with prolonged ground contact of the feet (Krantz 1992), and a suppression of vertical body oscillation, a so-called compliant walk (Alexander 1977). This bent-hip, bent-knee bipedal gait is deviant from the human stiff-legged mode, and has been frequently commented upon by eyewitnesses for its conspicuous fluid grace (“like riding on a bicycle” or “cross-country skiing”). An identical mode of walking was suggested for Australopithecus afarensis (Stern and Susman 1983), albeit in the absence of any reference to, or presumably knowledge of, Sasquatch gait.
Sighting records collected by Green contain variable reports of running Sasquatches. For example, at initial encounter, 13 percent were running, while, upon departing, 9 percent ran and the rest walked away. Despite the fact that efficiency of locomotion rises substantially with speed (Heglund 1985), such running as occurs in the Sasquatch seems to be restricted to short bursts of speed to reach cover, during which the metabolism for a Sasquatch could rise approximately ten- to twenty-fold (Jungers 1985a), and, hence, would be used sparingly. The transition of walking to running has been established at about 5.6 mph (9 kph) for humans, although speed walkers, with their decidedly unnatural hip action, exceed 8 mph (13 kph) (Alexander 1977, Cavagna, Heglund, and Taylor 1977). Experiments such as I have done myself indicate that the transition to running occurs at about 150 percent of normal human step length. In the Sasquatch, the fastest walking cadence that has been observed is about 140 steps per minute, or 160 percent of the Patterson film rate. A 150 percent value of normal step length, inserted into the graph (Fig. 8, upper line), indicates a level at which the animal most probably shifts from walking to running.
Only 6 percent (18 of 297) of the trackway records exceed this extrapolated boundary, a function of an underreporting of running trackways for the reasons pointed out above, and a presumptive reluctance of these heavy animals to run at all in their customary terrain. Scaling formulae for quadrupeds for both speed and cadence at the transition in gait patterns are available (McMahon and Bonner 1983). These, if applied by weight alone to this biped (at the mean), indicate a walking-running transition of about 14 mph (22 km/hr), and a cadence of 120 steps per minute. The speed indicated in the graph is not applicable to running steps, with their much higher cadence and speed.
The maximal speed that a Sasquatch is capable of attaining has not been reliably tracked, although many casual reports refer to observers driving in a vehicle parallel to a running Sasquatch. Before rejecting unbelievable sounding speeds or step intervals, it is well worth keeping human records in mind. For example, the world record walking speed over 20 km is about 11 mph (18 kph), the top running burst speed about 27 mph (43 kph), the longest single jump near 30’ (9 in), and the longest triple jump—in effect, three running steps—about 60’ (18 in), all this with a physique of decidedly smaller scale than that of a Sasquatch. I would estimate the top running speed of the Sasquatch to be near 35 mph (56 kph), the speed of a galloping horse.
Weight and Calories
Weight estimates are notoriously difficult to arrive at by visual observation due to the cubic ratio (exponent of 2.9 in humans; McMahon and Bonner 1983) of weight to linear dimension. Human ratios, especially when applied to footprints (Robbins 1986), are clearly inappropriate. Some extrapolations have used the width of the dimensions of the heel or cubic volume of body parts (Krantz 1992), or the width of the ball of the foot. Estimated or calculated weights for the Patterson film Sasquatch (in Krantz 1992) range from 280 lb. (127 kg) (Grieve), through 350 lb. (159 kg) (Gimlin), 500 lb. (227 kg) (Patterson and Krantz), 650 lb. (295 kg) (Willoughby 1978), 800 lb. (363.6 kg) (Titmus and Green) to 2,028 lb. (920 kg) (Glickman 1997). Glickman (1997) has used digital image analysis for producing correlative measurements between various frames of the movie, a process not readily verified.
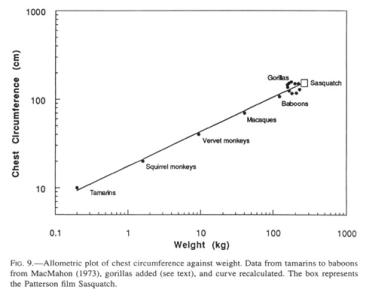
I will here generate an estimating mode that will use measurements readily accessible to the reader. Specifically, I propose to use a scaling formula for weight of primates that has predictive value from tamarins to baboons (McMahon 1971). This formula consists of an allometric relationship between chest circumference (C) and weight (W), presumably for the functional reason that the lung volume, and by implication respiratory exchange, scales isometrically with body mass (Stahl 1967). Since gorillas reach maximally 550 lb (250 kg.) in the wild (Willoughby 1978), and have been reported to attain 631 lb. (287 kg) in captivity (Raven 1950), it is prudent to include values for these large primates. To this end, I have added 10 pairs of gorilla measurements (mountain and lowland gorillas, from Willoughby 1978, and Napier and Napier 1967) and recomputed the regression formula of MacMahon (1971). The original formula was
![]()
(C = chest circumference in cm; W = weight in kg), while the formula that includes the gorillas is
![]()
with a correlation coefficient of 0.956. The recomputed formula has the additional gratifying feature that it is satisfactorily applicable to human dimensions.
The Patterson film Sasquatch chest circumference can be estimated by taking the chest width from the oblique rear views in the film (with an included vertical foot [14.5”] for scale). These film images (frames 61 and 72), printed on display stock and commercially available, are slightly over one-half second removed from each other, hence the distance increase is negligible, especially in view of the camera distance of approximately 120’ (37 in). Also, the two photographs have the same photographic magnification, as can be verified by reference to objects in the background common to both images. The foot of these images measures 27 and 28 mm in length, respectively. Since no amount of tilting can make the foot appear longer than its actual size, I will equate 28 mm to 14.5” (1.931 mm/inch) in the plane of the animal. The width of the chest, measured between two imaginary lateral points a short distance below the axilla, measures maximally 32 mm, a value that has to be corrected for the rotation of the body away from the line of sight. This angle was averaged at 40º by Krantz (1992), and calculated at 41.4º by Glickman (1997). The raw width value is corrected by dividing it by the cosine of this angle. This operation yields a 42.7 mm or a 22.1” (56.1 cm) chest width for the animal. Glickman (1997) has calculated the ratio between chest width and depth to be 0.67, while that measured ratio in mountain and lowland gorillas falls between 0.69 and 0.74 (Raven 1950, Schaller 1963). An average of 0.71, used here, gives a chest depth of 15.7” (39.8 cm), although eyewitnesses have repeatedly described the chest of a Sasquatch “as deep as it was wide,” or as “barrel-chested.”
These two measurements, of which at least the first can be extracted from a single image with minimal conjecture or mathematical manipulation, compare as follows to values in the literature:
![]() Author Chest width Chest depth Calculated circumference
Author Chest width Chest depth Calculated circumference
Krantz (1992) 17.6”
(44.7 cm) 15.2” (38.6 cm) 51” (130 cm)
Green (1968) 22” (55.9
cm) 19” (48.3 cm) 64.6” (164 cm)
The author 22.1” (56.1
cm) 15.7” (39.8 cm) 60” (152:3 cm)
Glickman (1997) 31.4” (79.8 cm) 20.9” (53.1 cm) 84.1” (214 cm)
![]()
Short of waiting for the first preserved Sasquatch specimen, I invite readers to obtain the images in question, and to verify these values to their own satisfaction. The largest quoted chest circumference requires the obliquely projected chest width to be 40 mm wide, a distance that extends well beyond the edges of the chest in the picture, or else a foot that is 18.1” long.
Next, one can apply a simple engineering formula (Bosch 1970) for an approximation of the circumf~rence of an ellipse
Circumference = 3.33a + 2.95b
where a and b are the half axes of the ellipse. The value for the chest circumference by this method is 60” (152.4 cm). When this value is entered into the scaling formula,
![]()
(C = chest circumference in cm, W = weight in kg), and the equation is solved for W, a weight of 246 kg (542 lb.) emerges. Lest the reader place excessive faith in the precise numbers, I should caution that a millimeter of raw width measurement translates into roughly 20 kg (44 lb.) of calculated weight, and an extra 0.5” foot length adds 10 kg (22 lb.). The range of weights in the plotted gorillas suggests a weight range for a Sasquatch of the Patterson film-size of between 180 and 310 kg (400 to 700 lb.) (Fig. 9). Both lean and paunchy Sasquatches have been observed. Since gorillas are rather barrel-chested in relation to their weight, their inclusion drops the calculated Sasquatch weight 33% from 369 kg (812 lb.), a weight which is obtained with the original formula of MacMahon (1971), based only on smaller primates.
On the assumption that chest circumference scales linearly with the height of the animal, I have scaled the Patterson film values (slightly below the mean as a female) to the calculated mean heights, and have generated a comparison table (Table 1).
Since the reference heights are derived from a formula that is conservative, the weights are most likely more so. A sobering detail concerning scaling from skull dimensions is the observation that a comparison of predicted to actual weights produced a range from —60 percent to +30 percent deviation in larger monkeys and small apes (Smith 1985). It is hoped that chest circumference is a closer predictor.
 Several
corollaries accrue from increased weight in this primate. First of all, large
size alone provides the quickest access to dominance over other species in the
environment, of which the most formidable competitor originally must have been
the brown bear, though diurnal in habits. The Sasquatch, in contrast, is
compellingly nocturnal (see Appendix 1). Most adaptive for the Sasquatch is
the increased resistance to cold, since the radiative body surface increases
with the square of the linear dimensions, whereas the heat-generating mass
increases at roughly the third power. The climate of much of its range, to
which the records of this article pertain, is wet and maritime, decidedly
unpleasant to humans for much of the year unless suitably equipped, though not
frigid, while the inland areas experience much more severe winters.
Several
corollaries accrue from increased weight in this primate. First of all, large
size alone provides the quickest access to dominance over other species in the
environment, of which the most formidable competitor originally must have been
the brown bear, though diurnal in habits. The Sasquatch, in contrast, is
compellingly nocturnal (see Appendix 1). Most adaptive for the Sasquatch is
the increased resistance to cold, since the radiative body surface increases
with the square of the linear dimensions, whereas the heat-generating mass
increases at roughly the third power. The climate of much of its range, to
which the records of this article pertain, is wet and maritime, decidedly
unpleasant to humans for much of the year unless suitably equipped, though not
frigid, while the inland areas experience much more severe winters.
Increased size also implies high mobility and a correspondingly large home range. A rare, individually identifiable Sasquatch was reported over a span of 8 years in several locales in Washington and Oregon, the most distant sites having a linear separation of more than 150 miles (240 kin). If we take this distance as a lifetime radius of activity, we get an area (πr2) of more than 70,0002 miles (180,0002 km) of mainly forested terrain. This value encompasses a substantial portion of, for example, Washington State, and cannot be considered indicative of any particular home range. Also, it emphasizes the difficulty of any contemplated scheme of organized field study of the species other than to concentrate on regions of recent sightings.
Secondly, according to Kiciber’s Law (McMahon and Bonner 1973), which states that the basal metabolic rate scales as the 3/4 power of mass, a massive animal needs less energy input per gram of body weight than a small one does. This means that a Sasquatch can get by with a relatively smaller amount of food than a smaller animal. Nonetheless, if we use the calculated weight (W) of a Sasquatch at the population average (299 kg) and apply the scaling formula
![]() (Kleiber 1961),
(Kleiber 1961),
a basal caloric consumption of about 5,000 calories per day is found. With exercise and inclement weather, this value may double or triple. Hence, a diet that is minimally omnivorous, if not slanted toward carnivory for the sake of calories—especially during the winter—is required to fulfill that demand. Bipedal gait, seemingly as efficient as a quadrupedal gait (Rose 1984), can be viewed as an adaptation to becoming an endurance hunter in the very demanding terrain inhabited by the Sasquatch.
Eyewitness reports tell of white-tailed deer, Odocoileus virginianus, mule or black-tailed deer, Odocoileus hem ionus, and American elk (=wapiti), Cervus elaphus (=canadensis), being killed by having their heads crushed or their necks twisted without claw marks or bite wounds. The head was sometimes separated from the body, and the body cavity torn open with the internal organs missing, while the hide-covered carcass remained on occasion. The latter has been found sometimes partly hidden under branches or deposited in a tree, in all cases surrounded by appropriate footprints. If we use published weight ranges for these three ungulate species, assign about 25 percent to internal organs, and a caloric value of about 500 calories per lean pound (Watt and Merrill 1963), we can then estimate a calbric content of the innards: 12,000—35,000 calories for 0. virginianus, 20,000—50,000 for 0. hemionus, and 60,000—90,000 for C. elaphus. These values would rise dramatically (about 3,500 cal/lb.) with the inclusion of retroperitoneal fat stores around the kidneys. A Sasquatch would probably engage in “binge” eating, punctuated by lean periods, as has been described in dramatic and picturesque detail for the Eskimos by Mowat (1951). Examination of the database with an eye to exploring whether the Sasquatch builds up fat in the fall has shown that “skinny” vs. “fat” Sasquatch sightings are evenly distributed throughout the year.
The initial organ selectivity may have its root partly in the nutritive value of the internal organs, generally adorned with fat, and partly in their friable nature, which is especially more easily dealt with by the flat molars of a primate as compared to the carnassial teeth of carnivores. Possible retention of the carcass would “ripen” the meat and soften its texture, allow for hypothetical winter storage, and contribute to the often noted “rotten meat” aroma of a Sasquatch at close range.
Scaling formula for average daily food intake by herbivores
![]()
or carnivores
![]()
(Bourlière 1975) provide amounts of 19 kg (41 lb.) and 14 kg (31 lb.) per day, respectively, for the average Sasquatch, whose consumption with a mixed diet would lie between these values.
Additionally, partial carnivory limits the species to low biomass density, i.e., numbers of animals per given area, and thereby reduces its social structure, if any, to small and sparse groups (McNab 1963), in congruence with the rarity of grouped Sasquatch sightings or footprints.
Finally, scaling of body weight to brain size in primates has been pursued by numerous authors (e.g., Armstrong 1985, Martin 1984, Martin and Harvey 1985, Stephan 1972), all of whom provide allometric formulae. An exploration of these leads to various results, with the brain size of the average Sasquatch ranging up to 770 cc. This estimate could be grossly in error if it is subsequently found that the Sasquatch has evolved a brain size above the trend applicable to the great apes. By comparison, the brain of mountain gorillas averages 532 cc, with a range from 420—685 cc (Raven 1950). I am loath to pursue this subject in view of the uneven brain evolution among the primates, the absence of head anatomy for the Sasquatch, and the diversity of scaling formulae. In the absence of any reports of cultural traits or fire use, very minimal and primitive tool use, and inferred low sociality for the Sasquatch, we are reduced to conjectures regarding their need to remember a presumptive large home range.
All of these traits argue against an evolutionary need of complex communication, as is needed in the transmission of cultural acquisitions. Nevertheless, the vocal abilities of the Sasquatch, aside from potent screams, roars, and growls, range well beyond those of the great apes, and suggest proto-linguistic faculties or even primitive communication (Berry and Slate 1976, Berry and Morehead, personal communication and recordings, Kirlin and Hertel 1980).
As an aside, the often reported prodigious upper body strength of the Sasquatch can be profitably viewed in the light of human weight lifters in whom lifting ability rises at the 2/3 power of their weight (Lietzke 1956). If one uses the formula
![]()
for maximum human weight lifting ability, extrapolated to the weight of the average Sasquatch (299 kg): it yields 1,300 lb. (610 kg). The build of the Sasquatch, in parallel with that of the great apes, indicates muscle insertions
more distal to joints with an attendant rise in the mechanical lever arm. This factor, together with presumptive larger muscle cross-sections, suggests that its real capability is apt to be much greater than that of humans, though probably not expressed in the motivated fashion of a competitive weight lifter. An orang-utan, with a weight of about 200 lb. (90 kg) and a height of about 4.5 feet (1.3 in), was estimated to be four times as strong as a human (Schwartz 1987), and was observed to start carrying a woman under one arm up a tree (Galdikas 1994). The reported ability of the Sasquatch to tip over a commercial trailer, lift up one end of a car, roll over a jeep or snowmobile, push mobile homes off their foundations, lift rocks in excess of 230 lb. (104 kg) to unearth rodents in rock slides, or throw baseball- to basketball-sized rocks in a high arc to discourage human intruders in the manner of chimpanzees (Goodall 1986) seems not unreasonable in this light.
Plantar Pressure
If one refers to the calculated weights and foot lengths in Table 1, the possibility arises of extrapolating plantar pressure of feet of different-sized individuals. Krantz (1992) has pointed out in this connection that the compressive strength of cartilage has certain inherent limits that can only be exceeded at risk of health and joint integrity of the animal in question. Additionally, compression of the sole beyond the limits of tissue pressure would collapse capillaries and eventually lead to breakdown akin to that found in de cubitus ulcers. Since any animal is likely to be optimally adapted to its own weight, support, and gait configuration, even the Sasquatch would adhere to such general rules of body design.
Admittedly, the following calculations have an element of circularity in them, so the resultant output should only be viewed as an approximation. I have used Sasquatch footprint casts of several sizes and various proportions in my possession, measured their area by planimetry, and matched them to their scaled body weight by the method detailed above. The calculated sole pressure varies from 6 lb./in2 to 12 lb./in2. The Patterson film Sasquatch print, which is relatively narrow, covers between 60 and 65 in2 with a calculated weight of 542 lb. (246 kg), a relationship that translates into a plantar pressure of 8.3—9.0 lb./in2. Comparison values for the human foot are about 10 lb./in2 (0.69 kg/cm2) for the contact area of the foot or 5 lb./in2 (0.35 kg/ cm2) for the entire sole (foot outline) (Robinson 1990), a value that drops to about 2.5 lb./in2 (0.18 kg/cm2) for a booted foot, a common reference in the field. Thus, a Sasquatch footprint generally would be expected to show 4—5 times more pressure per given area than a comparison boot print. Anecdotal reports often suggest higher weights, though generally without experimental backing other than jumping on one foot or carrying a second person without much effect.
The sole pad of the Sasquatch foot is probably several inches thick, as revealed in one case by a small rock that was found to have deeply indented a sole that made the footprint surrounding the rock (Cachel 1985, Krantz 1983). Usually, the foot shows no wrinkles or folds, although there are occasional scars. This thick pad, a tough connective tissue lattice filled with fat as described by Tietze (1921) for humans, presumably serves to distribute the weight over the sole in a much more even fashion than is the case in humans, and serves to return some of the compressive energy by elastic rebound (Bennett and Ker 1990). In any case, contrary to popular belief, plantar pressure in even large Sasquatches does not appear to range exorbitantly beyond human values, as one would reasonably expect from anatomical considerations.
Growth and Life Cycle
Since almost all data presented here are gender neutral, it is next to impossible to extract values for presumptive sexual dimorphism. Beyond that, we have no idea of the age of any reported animal beyond comparing a juvenile to the age of corresponding human children. Even if several specimens of the Sasquatch suddenly became available, the dynamic aspects of the species would remain virtually unknown. Although many aspects of the life cycle of a mammal can be scaled to body mass, it is more challenging to apply what minimal data we have to estimating age and a growth curve, in this case of the female of the species (Fig. 10). I should emphasize that this curve is predicated on the growth of feet rather than general somatic dimensions, which would follow a slightly different curve.
To fix the endpoints, I have taken the foot lengths of human neonates (3.2” [8.1 cm]; Roche and Malina 1983) and mountain gorilla newborns (3.7” [9.4 cm]; Schaller 1963) as a starting point (about 3.5” [8.9 cm] for the Sasquatch). The smallest, intermittently walking footprints deposited by a juvenile Sasquatch that have been recorded are 4”-5” (10-13 cm) long. That length corresponds to the mean of the human foot at one year (Jones 1997), which is the age that I have arbitrarily assigned to these prints, although walking is probably initiated earlier than in humans, as Sasquatch growth is not dominated by the disproportionate size of the brain and head (its head has repeatedly been reported to be “small for its body”).
To fix the opposite end point of the graph, I have collected all records consisting of a single large set of prints accompanied by one set of “baby” footprints (smaller than 7”), on the assumption that the mother, by implication a mature and no longer growing female, is most likely the exclusive adult companion of a juvenile for the first few years of its life. It is questionable whether a female in the wild would keep growing after the physiological stress of giving birth.
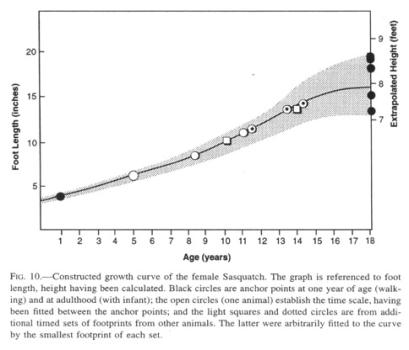 Lastly, I have received
three separate sets of timed footprint measurements (from three different
observers), each stretching over several years, that were considered to
originate from three growing animals. The set with the longest time base,
debatable though it may be with respect to the identity of the animal in
question, was used to produce the time axis for the graph, while the remainder
were fitted to the resultant curve.
Lastly, I have received
three separate sets of timed footprint measurements (from three different
observers), each stretching over several years, that were considered to
originate from three growing animals. The set with the longest time base,
debatable though it may be with respect to the identity of the animal in
question, was used to produce the time axis for the graph, while the remainder
were fitted to the resultant curve.
The graph suggests a rapid growth for the Sasquatch such that a juvenile animal, age 8 years, with a foot length of about 9” (23 cm), would be about 5’9” to 6” in height (173-183 cm), in effect the size of an adult human male. In some rare instances, juveniles with a height of 3’-4’ (90-120 cm) have been reported by themselves, but usually they are near their mother at that age and size.
Additional speculative inferences can be drawn from combining this graph with rare multiple sightings and grouped footprints. Surviving offspring seem to be spaced at intervals of about 5 years, as estimated from presumptive “family” groupings of footprints. A female with a very small, i.e., nursing, infant has never been reported, an indication that the mother can avoid absolutely all contact with humans when in this vulnerable state. Records of family groupings of prints suggest that an older sibling will stay with the mother for some years after the arrival of the next one, until about age 10, exhibiting its maternal attachment by occasionally “hitching rides” on the mother like the younger one. Such conclusions derive particularly from a long footprint trackway, in which the two smaller sets disappeared intermittently, while the largest set continued in a temporarily erratic line. Parental and, for that matter, sexual pair bonding has been reported on a few occasions by hand-holding between individuals.
The female probably reaches sexual maturity at about age 9-10 (extrapolated from the smallest adult of a mother-infant pair), by which time she will be near 6’ (1.83 m) in height. At this stage, the female has been observed to keep male company, and has developed small breasts, “pert” in an observer’s word. Development of breasts should be viewed as a consequence of an upright stance, which hides the genitalia normally prominent in simian females. Thus, the breasts may assume a pronounced role as a visible sex signal independent of the need for nursing, a task that can be accomplished with mammary glands devoid of the extra adipose tissue. A suspected gradual darkening in hair color with adulthood was not confirmed by the database, which produces identical height averages for coat colors grouped from dark through medium to light. Some tendency toward a geographical dine in coat color has been established by Gill (1980), though with limited data.
By applying scaling formulae to the 299 kg (658 lb.) body of the average Sasquatch, a gestation period of about 9 months and an average life span (in captivity) of 36 years can be estimated (Calder 1984). This life expectancy implies an occasional survival into the fifth decade, reports which account for descriptions of some animals as looking old and wrinkled, having “rotten, snaggle teeth,” and unkempt, matted “angora goat dreadlocks,” or patchy, worn hair. Survival times for gorillas in captivity range into the middle of the third decade of life (Willoughby 1978).
Scaling formulae exist to calculate other biological aspects such as respiratory rate, heart rate, and blood volume (Stahl 1967), limb proportions (Jungers 1985b), tooth size (Gingerich and Smith 1985, Willoughby 1978, Wolpoff 1985), and organ weights (Larson 1985), but it behooves me not to pursue speculative aspects of this subject ad absurdum.
Summary
The presented statistics provide, for the first time, population averages and ratios that relate foot length, height, and weight of the Sasquatch in a manner not dependent on guesses, opinions or individual anecdotal accounts. I have speculatively pursued all attributes of the species that could be derived or inferred from the presented data by correlation or allometric scaling. It is very probable that the Sasquatch population, being composed of animals with a long life span, few offspring, and little culling by predators, will display wide physical variations, seen in such reported aspects as facial features, diverse coat colors, and the large variance in foot proportions documented here. The data, furthermore, are indicative of a sizeable populatior of a species that has adapted in a variety of ways (except development of intellect) to the demands of surviving in the montane environments of the North American continent.
Acknowledgments
I am, above all, heavily indebted to John Green, who gave generously of his time and cheerfully accommodated my many requests to extract data out of his computerized database. The staff of the North American Science Institute, Hood River, Oregon, gave me free access to their collected sighting reports. I am appreciative of the constructive comments provided by John Green, John Bindernagel, Theodore Grand, Grover Krantz, Jeffrey Meldrum. John Senner, and several others who elected to remain anonymous.
Appendix I
The nocturnality of the Sasquatch has been questioned on occasion. This subject can also be approached statistically, though directed at the observers rather than the observed. Let us take a hypothetical area randomly seeded with Sasquatches, evenly distributed during day and night. Their apparent temporal distribution will depend on them being seen by human observers. Let us assume a very conservative ratio of such alert observers during daylight as compared to the hours of total darkness in the mountains to be 20:1. A daylight observer will have a circular observational area with a radius of, say, 500 feet (152 m);recognition of the subject will thus be unambiguous over roughly 800,0002 feet (72,0002 m).A night-time observer has, at best, the expanding cone of headlights in one direction with recognition of a grey object at 300 feet (91 m) (Bosch 1970), and an expanding width of illumination to 100 feet (30 m) a sector with an area of about 15,0002 feet (1,3502 m). Factoring in the number of observers produces a ratio of 800,000 x 20:15,000 x1, or better than 1,000:1. That is the ratio at which Sasquatch sightings should be distributed between day and night, a number that will get more extreme if flashlights or moonlight is the alternative illumination. An actual ratio cited by Green (1978) consists of 1,275 sightings, of which 735 occurred during the day and 540 during the night, or a 58 to 42 ratio (1.38 to 1). If only sightings on roads are considered, the ratio shifts to 1:1.4 in favor of night sightings. This discrepancy can be interpreted as activity by the Sasquatch that exposes it to being seen about 1,500 times more often at night than an even distribution would predict. This nocturnality would render the elaborate body language common to primates invisible most of the time, and might account for a compensatory development of more complex vocalizations in the Sasquatch.
References Cited
Alexander, R. McNeill
1977 Mechanics and Scaling of Terrestrial Locomotion. in: T.J. Pedley (ed.), Scale Effects in Animal Locomotion. London: Academic Press.
Armstrong, Este
1985 Allometric Considerations of the Adult Mammalian Brain, with Special Emphasis on Primates. in: William L. Jungers (ed.), Size and Scaling in Primate Biology. New York and London: Plenum Press.
Bayanov, Dmitri, Igor Burtsev, and Rene Dahinden
1984 Analysis of the Patterson-Gimlin Film: Why We Find it Authentic. in: Vladimir Markotic and Grover Krantz (eds.), The Sasquatch and Other Unknown Hominoids. Calgary: Western Publishers.
Bennett, Michael B., and R.F Ker
1990 The Mechanical Properties of the Human Calcaneal Fat Pad.in Compression. Journal of Anatomy, Vol. 171: 131—38.
Berry, Alan, and B. Ann Slate
1976 Bigfoot. New York: Bantam Books.
Bord, Janet, and Cohn Bord
1982 The Bigfoot Casebook. Harrisburg, Pennsylvania: Stackpole Books.
Bosch, Robert
1970 Kraftfahr-TechnischeS Handbuch. Stuttgart: Robert Bosch. Bourlière, François
1975 Mammals Small and Large: The Ecological Implications of Size. in: EB. Golley, K. Petrusewicz, and L. Ryszkowski (eds.), Small Mammals: Their Productivity and Population Dynamics. Cambridge: Cambridge University Press.
Cachel, Susan
1985 Sole Pads and Dermatoglyphics of the Elk Wallow Footprints. Cryptozoology. Vol.
4: 45—54.
Calder. William A., III
1984 Size, Function and Life History. Cambridge: Harvard University Press. Cavagna, Giovanni A., N.C. Heglund, and C.R. Taylor
1977 Walking, Running and Galloping: Mechanical Similarities Between Different Animals. in: T.J. Pedley (ed.), Scale Effects in Animal Locomotion. London: Academic Press.
Decry, Tod, Jeff Glickman, and Deborah Wolman
1997 Bigfoot Phenomenon Anecdotal Reports “A” Classification. Vol. 1. Hood River, Oregon: North American Science Institute.
Galdikas, Biruté
1994 Reflections of Eden: My Years with the Orangutans of Borneo. Boston: Little, Brown. Gill, George W.
1980 Population Clines of the North American Sasquatch as Evidenced by Track Length and Estimated Statures. in: Marjorie M. Halpin and Michael M. Ames (eds.), Manlike Monsters on Trial: Early Records and Modern Evidence. Vancouver: University of British Columbia Press.
Gingerich, Philip D., and B.H. Smith
1985 Allometric Scaling in the Dentition of Primates and Insectivores. in: William L. Jungers (ed.), Size and Scaling In Primate Biology. New York and London: Plenum Press.
Glickman, Jeff
1997 NASI: Patterson-Gimlin Film Research Results. Unpublished report.
Goodall, Jane
1986 The Chimpanzees of Gombe: Patterns of Behavior. Cambridge: Belknap Press/Harvard University Press.
Green, John
1968 On the Track of the Sasquatch. Agassiz, British Columbia: Cheam Publishing.
1978 Sasquatch: The Apes Among Us. Saanichton, British Columbia: Hancock House.
1980a Encounters with Bigfoot. Surrey, British Columbia: Hancock House.
1980b On the Track of the Sasquatch. Surrey. British Columbia: Hancock Housz.
1980c What is the Sasquatch? In: Marjorie M. Halpin and Michael M. Ames (eds.). Manlike Monsters on Trial: Early Records and Modern Evidence. Vancouver: University of British Columbia Press.
Heglund, Norman C., CR. Taylor, and T.A. McMahon
1974 Scaling Stride Frequency and Gait to Animal Size: Mice to Horses. Science, Vol.
186: 1112—13.
Heryford, Dennis, Michael Behm, Veryl D. Hutchinson, Ronald W. Whiteman, and James Young
1982 Offense Report. Grays Harbor County Sheriff’s Department, Montesa’to, Washington. Hewkin, James A.
1986 Investigating Sasquatch Evidence in the Pacific Northwest. Ctyptozoology, Vol. 5:
27—37.
1987 Observations of Two Lines of Sasquatch Tracks in Oregon. CryptL’zoology, Vol. 6:
78—84.
Hunter, Don, and Rene Dahinden
1993 Sasquatch-Bigfoot: The Search for North America’s Incredible Creature. Buffalo:
Firefly Books.
Johanson, Donald, L. Johanson, and B. Edgar
1994 Ancestors: in Search of Human Origins. New York: Random House. Jones, Kenneth L.
1997 Smith’s Recognizable Patterns of Human Malformation. Philadelphia: W. B. Saunders. Jungers, William L. (ed.)
1985a Size and Scaling in Primate Biology. New York and London: Plenum Press.
1985b Body Size and Scaling of Limb Proportions in Primates, in: William L. Jungers (ed.). Size and Scaling in Primate Biology. New York and London: Plenum Press.
Kirlin, R. Lynn, and Lasse Hertel
1980 Estimates of Pitch and Vocal Tract Length from Recorded Vocalizations of Purported Bigfoot. In: Marjorie M. Halpin and Michael M. Ames (eds.), Manlike Monsters on Trial: Early Records and Modern Evidence. Vancouver: University of British Columbia Press.
Klciber, Max
1961 The Fire of Life: An Introduction to Animal Energetics. New York: John Wiley. Krantz, Grover S.
1983 Anatomy and Dermatoglyphics of Three Sasquatch Footprints. Cryptozoology, Vol.
2: 53—81.
1992 Big Footprints: A ScientWc Inquiry into the Reality of Sasquatch. Boulder: Johnson Books.
Larson, Susan G.
1985 Organ weight Scaling in Primates. In: William L. Jungers (ed.), Size and Scaling in Primate Biology. New York and London: Plenum Press.
Lietzke, Milton H.
1956 Relation Between Weight-Lifting Totals and Body Weight. Science, Vol. 124: 486—
87.
Martin, Robert D.
1984 Body Size, Brain Size and Feeding Strategies. In: D.J. Chivers, B.A. Wood, and A.
Bilsborough (eds.), Food Acquisition and Processing in Primates. New York: Plenum Press.
Martin, Robert D., and RH. Harvey
1985 Brain Size Allometry: Ontogeny and Phylogeny. In: William L. Jungers (ed.), Size and Scaling in Primate Biology. New York and London: Plenum Press.
McMabon, Thomas A.
1973 Size and Shape in Biology. Science, Vol. 179: 1201—04.
McMahon, Thomas A., and J.T. Bonner
1973 On Size and Life. New York: W. H. Freeman.
McNab, Brian K.
1963 Biocnergetics and the Determination of Home Range. American Naturalist, Vol. 97:
133—140.
Mossman, David J., and W.A.S. Searjeant
1983 The Footprints of Extinct Animals. Scientific American, Vol. 248: 74—85. Mowat, Farley
1951 People of the Deer. New York: Jove Publications.
Napier, John R.
1972 Bigfoot: The Yeti and Sasquatch in Myth and Reality. New York: E. P. Dutton.
Napier, John R., and Prudence H. Napier
1967 A Handbook of Living Primates: Morphology, Ecology, and Behaviour of Nonhumo.n Primates. London and New York: Academic Press.
Perez, Daniel
1988 Big Footnotes: A Comprehensive Bibliography Concerning Bigfoot, the Abominable Snowmen and Related Beings. Norwalk, California: published by the author.
1992 Bigfoot at Bluff Creek. Norwalk, California: published by the author. Raven, Henry C.
1950 The Anatomy of the Gorilla. New York: Columbia University Press. Robbins, Louise M.
1986 Estimating Height and Weight from Size of Footprints. Journal of Forensic Sciences,
Vol. 31: 143—52.
Robinson, John R.
1990 Adult Foot Structure. Portland, Oregon: NIKE Sport Research Review (Aug/Nov), Special Advertising Section.
Roche, Alex F, and R.M. Malina
1983 Manual of Physical Status and Performance in Childhood. Vol. lB. New York and
London: Plenum Press. Rose, M.D.
1984. Food Acquisition and the Evolution of Positional Behavior: The Case of Bipedalism.
In:DJ. Chivers, B.A. Wood, and A. Bilsborough (eds.), Food Acquisition and Processing in Primates. New York: Plenum Press.
Sapunov, Valentin B.
1988 A Mathematical Analysis of “Snowman” (Wildman) Eyewitness Reports. Cryptozoology. Vol. 7: 61—65.
Schaller, George B.
1963 The Mountain Gorilla: Ecology and Behavior. Chicago: University of Chtcago Press.
Schwartz, Jeffrey H.
1987 The Red Ape: Orang-utans and Human Origins. Boston: Houghton Mifflin.
Smith, Richard J.
1985 The Present as a Key to the Past: Body Weight of Miocene Hominoids as a Test of Allometric Methods for Paleontological Inference. In: William L. Jungers (ed.), Size and Scaling in Primate Biology. New York and London: Plenum Press.
Sprague, Roderick, and Grover S. Krantz (eds.)
1979 The Scientist Looks at the Sasquatch (II). Moscow, Idaho: University Press of Idaho. Stahl, Walter
1967 Scaling of Respiratory Variables in Mammals. Journal of Applied Physiology, Vol.
22: 453—60.
Stephan, Heinz
1972 Evolution of Primate Brains: A Comparative Anatomical Investigation. In: Russell Tuttle (ed.). The Functional and Evolutionary Biology of Primates. Chicago: AldineAtherton.
Stern, Jack T., and R.L. Susman
1983 The Locomotory Anatomy of Australopithecus afarensis. American Journal of Physical Anthropology, Vol. 60: 279—3 17.
Tietze, A.
1921 Uber den Architektonischen Aufbau des Bindegewebes in der Menschlicl.en Fullsohle. Bruns’ Beitrage zur klinischen Chirurgie, Vol. 123: 493—506.
Watt, Bernice K., and AL. Merrill
1963 Composition of Foods. Washington, D.C.: U.S. Department of Agriculture. West. Geoffrey B.. J.H. Brown, and B.J. Enquist
1997 A General Model for the Origin of Allometric Scaling Laws in Biology. Science. Vol.
276: 122—26.
Willoughby, David P
1978 All About Gorillas. Cranbury, New Jersey: A. S. Barnes. Wolpoff, Milford H.
1985 Tooth Size-Body Size Scaling in a Human Population. In: William L. Jungers (ed.), Size and Scaling in Primate Biology. New York and London: Plenum Press.